Crypto trading involves betting on cryptocurrency price fluctuations using a CFD trading account or purchasing and selling the underlying coins via an exchange. CFD trading lets you wager on Bitcoin price movements without owning the currency.
If you think a cryptocurrency’s value will climb, you may go long (buy) or short (sell). Both are leveraged securities, so you just need a little investment to obtain 100% exposure to the underlying market. Leveraged crypto trading increases gains and losses since profit and loss are still dependent on the investment amount.
Investing in bitcoin options reduces risk and increases market exposure. Crypto options trading is a “derivative” financial product whose value is derived from the underlying cryptocurrency.
Before trading crypto, it’s necessary to grasp the assets and technology involved. Bitcoin has spawned hundreds of alternative cryptocurrencies.
Trading cryptocurrencies may be hard, requiring expertise and a range of components. Bitcoin was the first cryptocurrency and remains the biggest in market valuation and popularity.
Over time, a whole industry of marketable digital assets has emerged. Ether is the biggest altcoin (ETH).
This tutorial explains crypto trading methods, platforms and apps, trade components, trading styles, and the significance of technical and fundamental analysis in constructing a trading strategy.
Cryptocurrency Trading for Beginners
How to trade cryptocurrency varies. Before trading cryptocurrency, one must have enough information. Decisions should be made depending on the dangers and legislation in one’s jurisdiction.

Trading Steps
Cryptocurrency Exchange Signup
Unless you possess bitcoin, you’ll need a crypto exchange account. Coinbase, Binance, and Gemini are top crypto brokerages. All three sites feature an easy-to-use interface and a variety of cryptocurrencies.
You must provide personal identifying information to create a crypto brokerage account, much like a stock brokerage. Know Your Customer (KYC) criteria include your address, date of birth, SSN (in the US), and email address.
Invest
After joining a crypto brokerage, you must link your bank account. Most exchanges allow debit cards and wire transactions. Wire transfers are the cheapest method to fund Coinbase and Gemini accounts.
Bitcoin and Ether are the most popular cryptocurrencies. These cryptocurrencies move more predictably than smaller altcoins, allowing technical indicator trading.
Altcoins are popular among cryptocurrency speculators. Small mid-market cap cryptos have greater upside potential than huge cryptos.
Cryptocurrency Storage
Active BTC traders must retain their money on the exchange. Buying Bitcoin for the medium to long term requires a wallet. Cryptocurrency wallets are software and hardware. Hardware wallets provide the highest security since they store bitcoin offline.
Trading Basics
A 24-hour market determines Bitcoin’s value second-by-second and day-by-day. Bitcoin’s volatility is unusual compared to other currencies since its value is established by an open market.
Newcomers should know how crypto-asset markets function so they may securely traverse the markets, even sporadically, and get the most out of crypto trading.
Bitcoin trading may be as easy as cashing out to a fiat currency like the U.S. dollar or as sophisticated as employing trading pairs to effectively ride the market and create an investment portfolio. The size and intricacy of a crypto deal enhance a trader’s risk.

Technical Analysis
Technical analysis (TA) analyzes price and volume to anticipate price movement. Here are several macro- and micro-level TA indicators that traders may use to assess the market.
Market Cycles
Traders may recognize patterns across hours, days, months, and years of market activity. The market’s structure causes specific behaviors.
Accumulation, markup, distribution, and decline make up the cycle. As the market swings between stages, traders consolidate, retrace, or correct as needed.
The bull and the bear act differently in shared environments. Traders must recognize their function and which one dominates the market. Technical analysis is needed to position oneself in an ever-changing market and to navigate ebbs and flows.
Whale-Chasing
“Whales” with huge trading funds cause price changes. Some whales act as “market makers,” placing bids and asks on both sides of the market to generate liquidity and profit. Whales exist in stocks, commodities, and cryptocurrency.
A bitcoin trading strategy must take whales’ chosen TA indicators into account. Whales are smart. By predicting whales’ moves, traders may benefit from their expertise.
Psychology
With so many analogies, it’s easy to forget that actual people are behind these transactions and are vulnerable to emotional behaviors that might impact the market.
The psychological cycle gives a more thorough view of market mood than the bull/bear paradigm. Although one of the fundamental laws of trading is to avoid emotion, group mentality often prevails. The move from optimism to euphoria is fuelled by FOMO from market participants.
Timing an exit between exhilaration and complacency is key to avoiding bears and panic selling. High-volume price activity might suggest market momentum. The “buy low” mentality is obvious, considering that the greatest moment to accumulate is after a price decline. Risk equals reward.
Serious traders must not allow media, chat groups, or so-called thought leaders’ hot comments and analyses to influence their trading approach. Whales and others who can impact the market’s pulse manipulate these marketplaces. Do your research and trade crypto decisively.
Toolkit
Macro clarity requires being able to see market trends and cycles. Knowing where you stand is crucial. You want to be the expert surfer who recognizes when the ideal wave is coming instead of paddling aimlessly.
The micro viewpoint is equally important for strategy. We’ll merely cover the most fundamental TA signs.

Resistance/Support
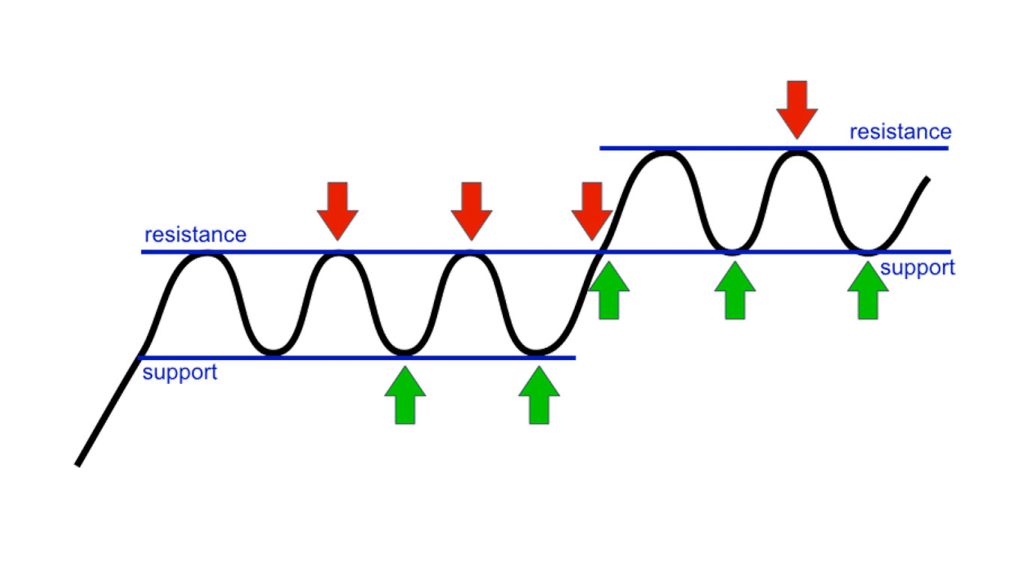
The phrases “support” and “resistance” refer to price barriers that arise in the market, limiting price movement from moving too far in a specific direction.
Support is the price level when the demand stops the downward trend. Traders purchase low when prices fall, providing a support line. Resistance is the price level when a sell-off halts an upward trend.
Many cryptocurrency traders employ support and resistance levels to wager on the price, changing when it violates upper or lower boundaries. Traders may enter or exit positions after the floor and ceiling are identified. Buying low and selling high is typical.
If the price exceeds these boundaries, it indicates market sentiment. When a trend breaks, new support and resistance levels arise.
Trendlines
While traders often employ static support and resistance barriers, price movement tends to trend higher or lower when barriers fluctuate. A trendline may be drawn from a succession of support and resistance levels.
When the market is heading higher, resistance levels arise, price activity slows, and the price returns to the trendline. Support levels of an ascending trendline are closely watched by cryptocurrency traders since they assist in preventing a price decrease. In a downward-moving market, traders will link dropping peaks into a trendline.
Market history is crucial. As support and resistance levels recur, so do their trendlines. Traders note these hurdles to guide their trading technique.
Decimalize
Inexperienced or institutional investors’ obsession with round-number prices affects support/resistance levels. As a high number of transactions focus on a round number, like with Bitcoin when its price reaches $10,000, it might be difficult for the price to transcend this barrier, causing resistance.
It is evident that human traders are readily swayed by emotions and use shortcuts. Bitcoin price spikes tend to induce a flurry of market activity and expectations.

Moving Average
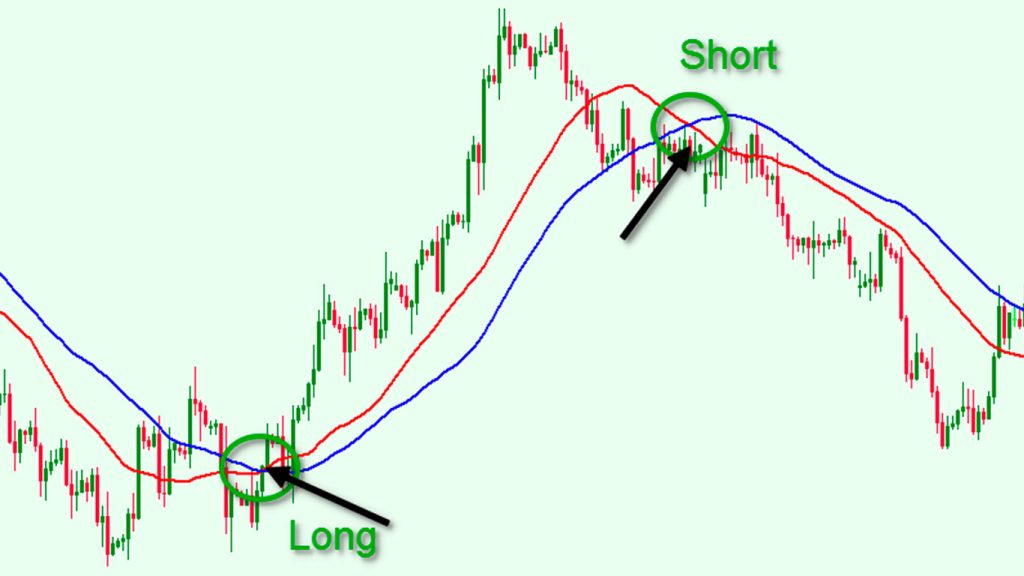
Traders smooth the market history of support/resistance levels and downward/upward trendlines to generate the “moving average.”
The moving average tracks support levels in an uptrend and resistance peaks in a downtrend. Moving averages are effective indicators of short-term momentum when compared to trade volume.
Candlestick
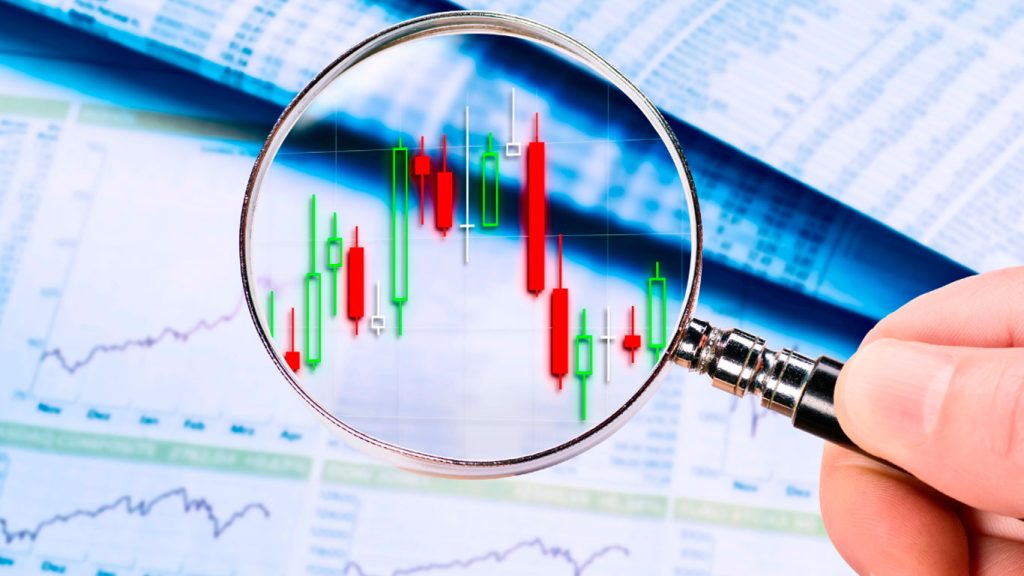
There are several approaches to tracking and detecting market trends. “Candlestick” is a frequent market price action graphic. These candlestick patterns help traders predict trends.
Candlestick charts were developed in Japan in the 1700s to examine how traders’ emotions impact price behavior beyond supply-and-demand economics. This market visualization is popular with traders since it contains more data than a line or bar chart. Candlestick charts show open, close, high, and low.
What’s the connection to cryptocurrency? Candlesticks are rectangular and have lines that imitate wicks. The wicks show an asset’s price range throughout the candlestick’s time. Candlesticks may reveal varied patterns according to the timeframe selected: from one minute to one day and beyond.


