
The total cryptocurrency TOTAL CAP (market cap) has possibly made a short-term bottom. It would confirm this with a breakout from the current descending resistance line.
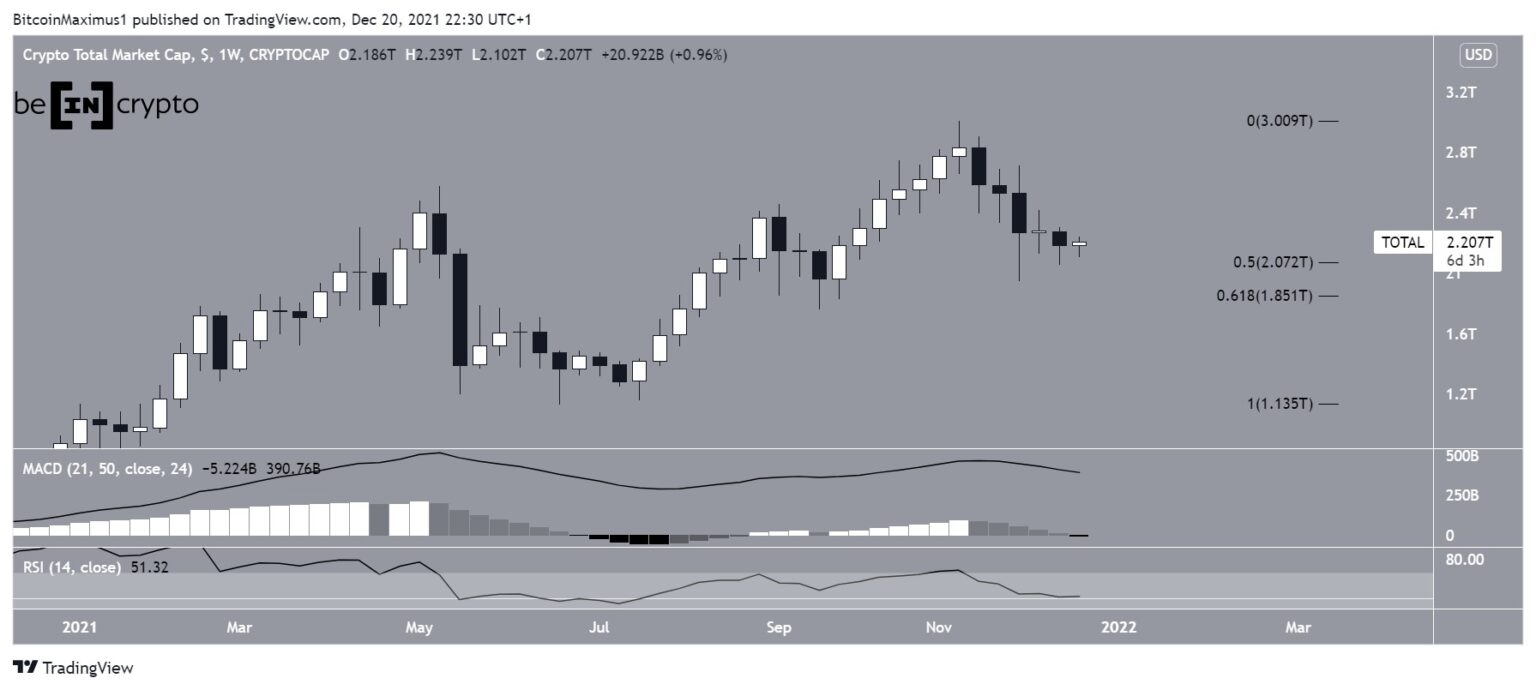
The weekly chart displays that TOTAL CAP has been falling since reaching an all-time high of $2.96 Trillion (Tn) on Nov 10. Further, it will fall l culminated with a low of $1.92 Tn on Dec 4.
Later, TOTAL CAP bounced, leaving a long lower wick in place. Further, most importantly, the wick was created inside the $1.85 – $2.07 Tn support area made by the 0.5-0.618 Fib retracement support level.
But technical indicators offer a neutral look.
Moreover, the MACD, which is created by a short- and long-term moving average (MA) is crashing but is still positive. This means that the short-term MA is speeding up, it is still faster than the long-term one.
At the same time, RSI is falling but is above 50. Basically, the RSI is a momentum indicator, and movements above/below 50 are considered signs of a bullish/bearish trend
In addition, cryptocurrency trader @AltstreetBet tweeted a TOTAL CAP chart, stating that an increase towards $2.6 Tn is expected.
Also, the daily chart does provide a more bullish outlook. This is noticeable from the bullish divergence in both the RSI and MACD. This is an occurrence that very often precedes bullish trend reversals. Therefore, it is possible that an upward movement will follow.
Presently, there is resistance at $2.37 Tn, created by a descending resistance line and horizontal resistance area.
If TOTAL CAP is successful in breaking out from the resistance line, the next horizontal resistance level would be at $2.63.
In addition, the Altcoin market cap (ALTCAP) provides a nearly identical outlook. The outlook is with the same bullish divergence present in both the RSI and MACD.